Posted in edx, statistics, R
Foundations of Data Analysis, Week1
Comment
edx 수업. R 을 이용해 실제 데이터에 학습한 통계 이론들을 적용하는 수업이다. edx 에서 제공하는 discussion board 대신에 piazza board? 이런것도 쓰고, lab 전에 비슷한 질문을 하는 pre-lab 도 있고.. 구성이 친절하다. 여러모로 신경을 많이 쓴듯
Classifying Variables
population (모집단) 의 각각을 unit, subject 라 부른다. Galapagos Tortoises 예제에서 unit 은 각각의 거북이들이다.
연구자들이 갈라파고스 거북이들로부터 몇 가지 특징들을 뽑아내 도표로 만들었는데, 이런 특징들을 varaible 이라 부른다.
variable 은 종류에 따라서 categorical, numerical 로 구분한다. 다른말로는 qualitative (= categorical), quantitative (= numerical) 이라 부르기도 한다.
날씨나 등 껍질 종류 같은 경우는 qualitative variable 이고 number of individuals repatriated 는 quantitative variable 이다. 저 속성이 뭔 소린가 했는데, 갈라파고스 거북이들은 섬의 중앙에서 보호를 받고 자라다가 나중에 야생으로 돌아간다고.. 그 숫자를 의미하는것이 number of indiviaudls repatriated 다.
complete counting 혹은 census (인구조사) 같은 경우는 대부분의 경우 힘들기 때문에 population 에서 일부를 떼어낸 sample 을 이용하게 된다.
It is common to use a smaller, representative group from the population, called a sample
Errors
sample 이 population 을 대표하지 못할 수도 있기 때문에, 완벽히 parameter (모수) 를 추정하는 것은 어렵다. 그래서 통계학자들은 point estimate 나 interval estimiate 를 사용한다. 예를 들면
"I am 95% confident that the true number of tortoises is actually between 561 and 1075."
true paramter 와 샘플로부터 얻어진 statistic 간 차이는 sampling error 라 부른다.
갈라파고스 거북이를 조사 할 때 밀집 지역에서만 거북이를 골라낸다고 하자. 그리고 그 샘플을 전체 지역에 대한 통계값을 얻을 때 사용하면 너무 높은 값이 나올 수 있다. 이런 종류의 오류를 bias 라 부른다. 다행히도 통계학자들이 bias 를 피할 수 있는 다양한 도구들을 준비 해 놓았으니 배우기만 하면 된다.
Levels of Measurement
아까는 variable 을 간단히 두 종류로 나누어 봤지만 더 자세하게 나눌 수 있다.
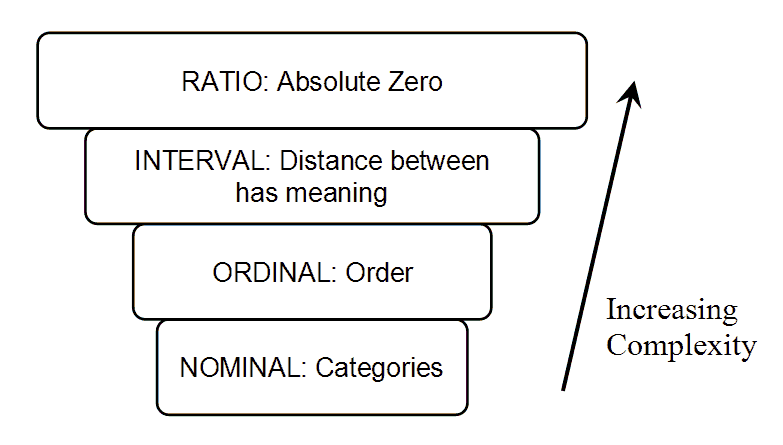
A nominal measurement is one in which the values of the variable are names. The names of the different species of Galapagos tortoises are an example of a nominal measurement
An ordinal measurement involves collecting information of which the order is somehow significant. The name of this level is derived from the use of ordinal numbers for ranking. If we measured the different species of tortoise from the largest population to the smallest, this would be an example of ordinal measurement.
With interval measurement, the distance between any two values has a specific meaning. An example commonly cited for interval measurement is temperature. A change of 1 degree is the same if the temperature goes from
0Cto1Cas it is when the temperature goes from40Cto41C. In addition, there is meaning to the values between the ordinal numbers. That is, a half of a degree has meaning.A Ratio measurement is the estimation of the ratio between a magnitude of a continuous quantity and a unit magnitude of the same kind. A variable measured at this level not only includes the concepts of order and interval, but also adds the idea of
nothingness, or absolute zero. With the temperature scale of the previous example,0Cis really an arbitrarily chosen number and does not represent the absence of tempertature. As a result, the ratio between temperature is relative, and40C, for example, is not twice as hot as20C.
간단히 정리하자면 nominal measurement 는 이름으로 분류를 할 수 있는 경우다.
ordinal measurement 는 각 unit 간 순위, 순서를 매긴 것이다. 이 경우 값 자체가 1, 2, 3 같은 순서기 때문에 unit 간 차이는 아무런 의미도 없다.
interval measurement 는 두 값간 distance (차이) 가 의미를 가지는 경우다. 온도를 잘 보면 40도와 39도의 차이 1은, 1도와 0도의 차이 와 같다. 그리고 interval measurement 에서는 각 unit 사이의 값들도 의미가 있다. (ex. 0.5도)
마지막으로 ratio measurement 는 nothingness 혹은 absolute zero 가 존재하는 값이다. 켈빈 온도의 경우 20K 는 40K 의 1/2 이다. 반면 섭씨 온도의 경우 20C 가 40C 보다 1/2 덥다고 말할 수가 없다.
이렇게 nominal, ordinal, interval, ratio 로 구분하는 방법을 Stevens' Theory 라 부른다. 단순히 numerical, categorical 로 구분하는 것 보다 좀 더 자세히 분류할 수 있다.
몇 가지 예제를 좀 더 살펴보자면
(1) 학생들의 gender, race, political opinions 등은 모두 nominal measurement 다.
(2) 학생들의 학년(7, 8, 9) 를 수집한다면 ordinal measurement 다.
(3) SAT 수학 점수를 모은다면, 그건 interval measurement 다. (아마 상대평가인가 봄)
(4) 나이, 키, 몸무게, 점수(0-100) 등을 수집한다면 ratio measurement 다.
nominal 에서 ratio 로 갈수록 값들이 점점 복잡해진다.
(http://www.ck12.org/statistics
이렇게 데이터를 구분하는 이유는, 각각 에 쓸 수 있는 Tool 이 다르기 때문이다. 어떤 툴은 categorical variable 에 유용할 수도 있고, 그렇지 않은 툴도 있기 마련이다.
References
(1) UT.7.01x Foundations of Data Analysis
(2) http://www.ck12.org/statistics